
Better a Blog: #2) Infographics, Charts and Quote Cards are Great Images, Too
Written by Maryellen Lazzaro on April 5, 2016
EXTENDED-CARE MARKETING EDITION
 Can you enliven your blog and improve your page views with just photos and videos? Sure, but it will be even that more interesting visually and that more relevant in content if you consider other images, too, such as infographics, charts, and quote cards.
For example, when reviewing your editorial calendar’s upcoming entries, you might realize that:
• “Parkinson’s disease in the elderly” lends itself to an eye-catching free infographic.
• “Broad range of therapeutic recreation activities” drives your point home when you add an original infographic.
• “Employee satisfaction continues to rank high” is better captured with a chart that easily conveys the statistics.
• “Celebrating National Nurses’ Week in May” makes a bold statement with a quote card.
Here are some tips to help you unearth or create interesting images for a lot less (and sometimes for free!).
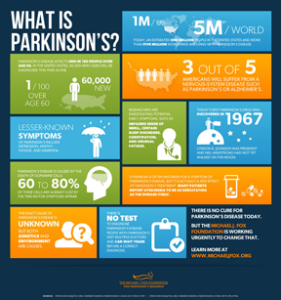 Free infographics. Many large healthcare systems and national nonprofit organizations associated with older adults (or the conditions to which older adults are vulnerable) produce infographics on a variety of healthcare topics and some of their infographics may be well-suited to your extended-care’s blog. These organizations typically provide the HTML embed code for each of their infographics to encourage you to use these professional-quality infographics on your blog. We found this Parkinson’s disease infographic for free on The Michael J. Fox Foundation for Parkinson’s Research website.
 Create original charts and infographics. One of our favorite ways for our extended-care clients to create charts and infographics is through Piktochart. Every template is fully customizable and the tools are intuitive and easy to use. First let’s address charts. A chart is actually a kind of infographic. You pick a chart style that works best (pie chart, a bar graph), plug in your data and the site creates the art for you. Similarly, with infographics, you pick the template that best suits your message and plug in your images and words and customize colors and fonts, as we have done here with our senior safety tips infographic.
Piktochart is available as a free account, but we recommend that you upgrade to a nonprofit pro account for $40 a year. The free account offers only about a dozen templates with some limitations such as the .png provided comes with a Piktochart watermark. The nonprofit pro account, on the other hand, gives you access to hundreds of templates, increases upload space up to 400MB, gives you the ability to download your infographic in various files sizes and types for use in potential print material, and allows you to remove their watermark.
 Quote cards. You’ve likely seen plenty of quote cards, but you may have not realized that that’s what they are called. Basically, you can feature a quote from one of your residents, patients, family member or staff member—or locate an applicable quote from a famous person on the internet—and place it over a colorful background. To show you that it doesn’t require any special expertise, we created the nursing quote card shown here using MS Word and then took a screenshot to crop it. The screenshot is a .png extension, which is the perfect file format for use on a blog or other social media platform.
Don’t know how to take a screenshot? On a PC, press the Windows logo key plus PrtScn. On a tablet, press the Windows logo button plus the volume down button. Your shot will be saved as a file in the Screenshots folder (which is in your Pictures folder). On a Mac, press Command-Shift-4, move the crosshair pointer to where you want to start the screenshot, drag to select the area, and then release your mouse or trackpad button. You’ll find the screenshot as a .png file on your desktop.
Final tip: Whenever you’re creating original infographics, charts or quote cards, keep your organization’s branding in mind. If possible, choose the fonts and colors that are in your logo or other branding efforts.
REMEMBER: Your time and cost investment in your original visual content will reap rewards because images, including infographics, charts and quote cards, can be used again and again like photos and videos throughout your other social media efforts.
> If you need help building or bettering a blog or using visuals of any kind, give Lazzaro Designs a call or shoot us an email.
> Coming soon: Tips on how to write a terrific blog entry.